02402 · Test Quiz 12
Question 1 of 9
The polar moment of inertia of a tube is calculated by the formula:
\({I_P} = \frac{\pi }{ {32}} \cdot \left( { {D^4} - {d^4}} \right)\)
where D is the outer diameter of the tube and d is the inner diameter of the tube
We assume that $\left( { {\mu _D};{\sigma _D}} \right) = (45;0.3\,)\,\text{mm}\quad \mbox{and}\quad \left( { {\mu _d};{\sigma _d}} \right) = (32;0.4{\kern 1pt} )\,\text{mm}$ and that the two diameters are independent.
The probability that the diameter difference (D-d) at a given location is less than 12.5 mm is:
Question 2 of 9
In a sports study one wants to investigate whether there is a difference in energy consumption for various types of training. We have (for a single person) measured the energy consumed in 10 jogs of 30 minutes and 10 bike rides of 30 minutes. Measurements, expressed in kcal, is given in the table below:
| Jogs | Bike rides |
|---|---|
| 314 | 294 |
| 340 | 317 |
| 331 | 317 |
| 333 | 310 |
| 329 | 327 |
| 322 | 300 |
| 332 | 293 |
| 330 | 321 |
| 338 | 307 |
| 325 | 304 |
Consider only data for the bike rides. What are respectively the lower quartile, median and upper quartile for these data? (It is assumed that the textbook definitions are used. These differ slightly from Python’s definitions.)
Question 3 of 9
A company works with a 3-shift operation, that is, it is running 24 hours with 3 different shifts of people working 8 hours. It is expected that the ‘down time’ on the machines is higher on evening and night shifts than it is on day shifts. In order to verify this the ‘downtime’ is registered on four machines of the same type in a period of time. The measured data is shown in the table below. The observations are listed as ‘down time’ in hours in the given period of time:
| Shift | Machine | Machine | Machine | Machine | Average |
|---|---|---|---|---|---|
| I | II | III | IV | ||
| Day shift | 30 | 35 | 59 | 38 | 40.5 |
| Evening shift | 58 | 55 | 64 | 49 | 56.5 |
| Night shift | 80 | 54 | 72 | 63 | 67.25 |
| Average | 56.0 | 48.0 | 65.0 | 50.0 | 54.75 |
We assume that the data follows a normal distribution.
Below, the ANOVA table for the problem is given as it was produced by Python. However, some of the numbers are substituted by letters: (In addition, the following information can be used: The “total sums of squares”, $SST$, equals $2434.25$)
    	  Df  Sum Sq Mean Sq F value  Pr(>F)
shift      2 1449.50  724.75  9.4430    D
machine    3  524.25  174.75  2.2769    E
Residuals  A    B       C
What is A, B and C?
Question 4 of 9
If you did the previous exercise, the following is a repetition:
A company works with a 3-shift operation, that is, it is running 24 hours with 3 different shifts of people working 8 hours. It is expected that the ‘down time’ on the machines is higher on evening and night shifts than it is on day shifts. In order to verify this the ‘downtime’ is registered on four machines of the same type in a period of time. The measured data is shown in the table below. The observations are listed as ‘down time’ in hours in the given period of time:
| Shift | Machine | Machine | Machine | Machine | Average |
|---|---|---|---|---|---|
| I | II | III | IV | ||
| Day shift | 30 | 35 | 59 | 38 | 40.5 |
| Evening shift | 58 | 55 | 64 | 49 | 56.5 |
| Night shift | 80 | 54 | 72 | 63 | 67.25 |
| Average | 56.0 | 48.0 | 65.0 | 50.0 | 54.75 |
We assume that the data follows a normal distribution.
Below, the ANOVA table for the problem is given as it was produced by Python. However, some of the numbers are substituted by letters: (In addition, the following information can be used: The “total sums of squares”, $SST$, equals $2434.25$)
    	  Df  Sum Sq Mean Sq F value  Pr(>F)
shift      2 1449.50  724.75  9.4430    D
machine    3  524.25  174.75  2.2769    E
Residuals  A    B       C
The influence of the machines on ‘down time’ is studied, a significance level of 5% is used. The conclusion and P-value become: (Both conclusion and argument must be correct)
Question 5 of 9
If you did the previous exercise, the following is a repetition:
A company works with a 3-shift operation, that is, it is running 24 hours with 3 different shifts of people working 8 hours. It is expected that the ‘down time’ on the machines is higher on evening and night shifts than it is on day shifts. In order to verify this the ‘downtime’ is registered on four machines of the same type in a period of time. The measured data is shown in the table below. The observations are listed as ‘down time’ in hours in the given period of time:
| Shift | Machine | Machine | Machine | Machine | Average |
|---|---|---|---|---|---|
| I | II | III | IV | ||
| Day shift | 30 | 35 | 59 | 38 | 40.5 |
| Evening shift | 58 | 55 | 64 | 49 | 56.5 |
| Night shift | 80 | 54 | 72 | 63 | 67.25 |
| Average | 56.0 | 48.0 | 65.0 | 50.0 | 54.75 |
We assume that the data follows a normal distribution.
Below, the ANOVA table for the problem is given as it was produced by Python. However, some of the numbers are substituted by letters: (In addition, the following information can be used: The “total sums of squares”, $SST$, equals $2434.25$)
      	  Df  Sum Sq Mean Sq F value  Pr(>F)
shift      2 1449.50  724.75  9.4430    D
machine    3  524.25  174.75  2.2769    E
Residuals  A    B       C
The influence of the shifts on ‘down time’ is studied, a significance level of 5% is used. The critical value and conclusion become: (Both critical value and conclusion must be correct)
Question 6 of 9
Let $ X_ {1} $ describe the weight of a random cola bottle filled with 0.25 l. Let $ X_ {2} $ describe the weight of a random empty cola bottle. It is assumed that these variables are normally distributed and independent with mean and variance as given here:
\[{X_1}:\quad \;({\mu _{ {X_1}}};\sigma _{ {X_1}}^2) = (626.9 g;4.{2^2} {g^2})\;\quad \mbox{and} \quad {X_2}:\quad ({\mu _{ {X_2}}};\sigma _{ {X_2}}^2) = (364.7 g;3.{6^2} {g^2})\;\]The probability that the weight of a random filled bottle of cola exceeds the weight of a random empty bottle with more than 265 g is:
Question 7 of 9
We repeat here from the previous exercise: Let $ X_ {1} $ describe the weight of a random cola bottle filled with 0.25 l. Let $ X_ {2} $ describe the weight of a random empty cola bottle. It is assumed that these variables are normally distributed and independent with mean and variance as given here:
\[{X_1}:\quad \;({\mu _{ {X_1}}};\sigma _{ {X_1}}^2) = (626.9 g;4.{2^2} {g^2})\;\quad \mbox{and} \quad {X_2}:\quad ({\mu _{ {X_2}}};\sigma _{ {X_2}}^2) = (364.7 g;3.{6^2} {g^2})\;\]The colas are sold in boxes of 24 bottles. It is assumed that the box weight is 1500 g (and potential variation of this number is ignored). The probability that the weight of a random box of filled colas is under 16500 g becomes:
Question 8 of 9
The probability density function of a normal distribution is shown below:
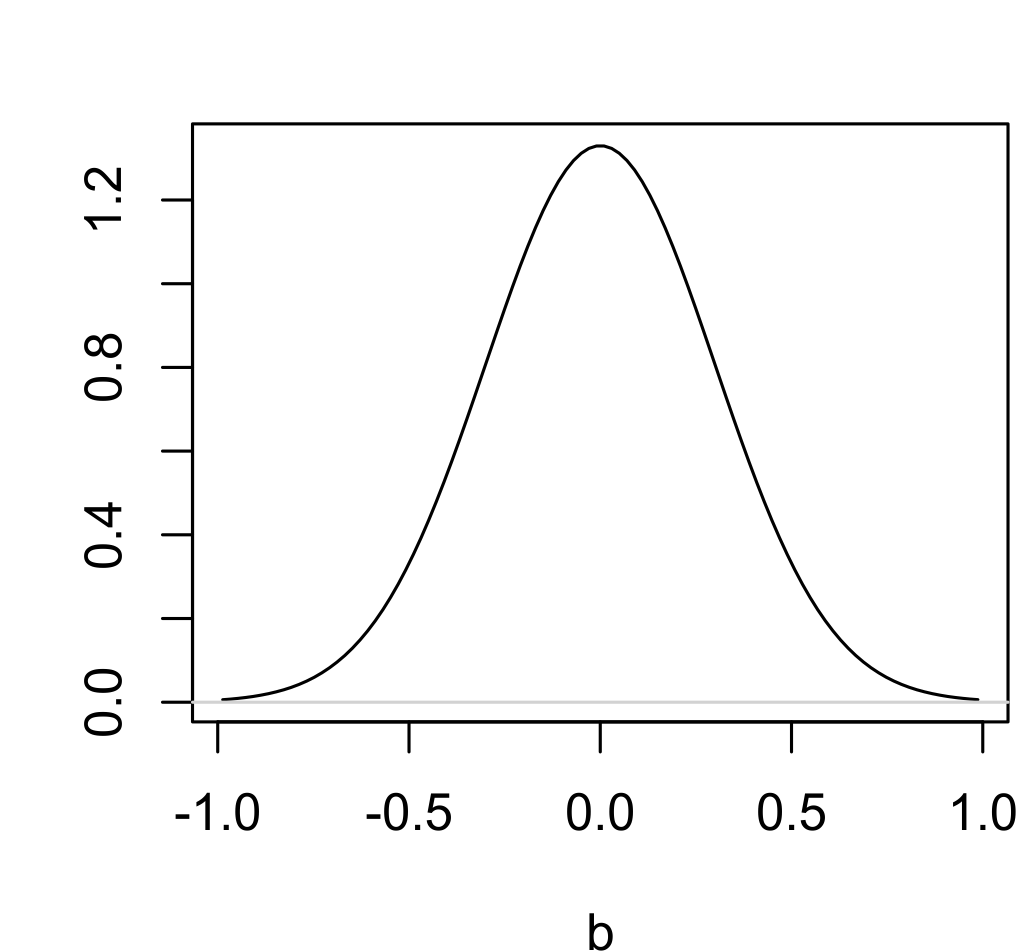
It is given that the standard deviation of the distribution is $\sigma = 0.3$.
The 2.5% and 97.5% percentile for the distribution in the middle is approximately?
Question 9 of 9
A used car dealer sells a car to a buyer, even though the dealer knows that the car will have a major breakdown within the next 6 month. The dealer provides a warranty of 1.5 months. Let X represent the length of time until the breakdown occurs. Assume that X is a uniform random variable with values between 0 and 6 months.
The probability that the breakdown occurs while the car is still under warranty is approximately: