02402 · Test Quiz 6
Question 1 of 7
The life time of batteries purchased from two different producers is investigated. The lifetime of a number of batteries from each manufacturer is recorded and the following data is available:
Producer A: \({n_A} = 15\quad \left( { { {\bar x}_A},{s_A}} \right) = \left( {122.4;30.5} \right)\)
Producer B: \({n_B} = 10\quad \left( { { {\bar x}_B},{s_B}} \right) = \left( {145.9;22.3} \right)\)
Data is assumed to follow a normal distribution in each group. What is the test statistic for and the conclusion about the hypothesis $ {\mu_A} = {\mu}_B $: (Both $t$-value and the conclusion must be valid)
Question 2 of 7
Data in the table below comes from a study where 14 patient’s systolic blood pressure was measured (in mmHg) before a certain medical drug treatment and 1 month after starting the treatment.
| Patient no | 1 | 2 | 3 | 4 | 5 | 6 | 7 | 8 | 9 | 10 | 11 | 12 | 13 | 14 |
|---|---|---|---|---|---|---|---|---|---|---|---|---|---|---|
| Blood pressure before treatment | 155 | 164 | 177 | 167 | 156 | 198 | 155 | 187 | 185 | 177 | 150 | 145 | 189 | 176 |
| Blood pressure after treatment | 165 | 154 | 172 | 156 | 150 | 185 | 145 | 182 | 165 | 166 | 145 | 150 | 169 | 172 |
A 95% confidence interval for the change in blood pressure becomes:
Question 3 of 7
In a sports study one wants to investigate whether there is a difference in energy consumption for various types of training. We have (for a single person) measured the energy consumed in 10 jogs of 30 minutes and 10 bike rides of 30 minutes. Measurements, expressed in kcal, is given in the table below:
| Jogs | Bike rides |
|---|---|
| 314 | 294 |
| 340 | 317 |
| 331 | 317 |
| 333 | 310 |
| 329 | 327 |
| 322 | 300 |
| 332 | 293 |
| 330 | 321 |
| 338 | 307 |
| 325 | 304 |
The following Python code was run:
x1 = np.array([314, 340, 331, 333, 329, 322, 332, 330, 338, 325])
x2 = np.array([294, 317, 317, 310, 327, 300, 293, 321, 307, 304])

var_x1 = np.var(x1)
var_x2 = np.var(x2)
mean_x1 = np.mean(x1)
mean_x2 = np.mean(x2)

t_stat, p_value = stats.ttest_ind(x1, x2)
paired_t_stat, paired_p_value = stats.ttest_rel(x1, x2)

print("Variance of x1:", var_x1)
print("Variance of x2:", var_x2)
print("Mean of x1:", mean_x1)
print("Mean of x2:", mean_x2)
print("t-statistic (independent t-test):", t_stat)
print("p-value (independent t-test):", p_value)
print("t-statistic (paired t-test):", paired_t_stat)
print("p-value (paired t-test):", paired_p_value)
with the following results:
Variance of x1: 52.04
Variance of x2: 118.8
Mean of x1: 329.4
Mean of x2: 309.0
t-statistic (independent t-test): 4.682272020223192
p-value (independent t-test): 0.00018552038908779776
t-statistic (paired t-test): 6.168301872365076
p-value (paired t-test): 0.00016503831607051134
Consider only data for the bike rides. Denote the true mean energy consumption by bike rides $ \mu $. A 99% confidence interval for $ \mu $ is:
Question 4 of 7
If you did the previous exercise, the following is a repetition: In a sports study one wants to investigate whether there is a difference in energy consumption for various types of training. We have (for a single person) measured the energy consumed in 10 jogs of 30 minutes and 10 bike rides of 30 minutes. Measurements, expressed in kcal, is given in the table below:
| Jogs | Bike rides |
|---|---|
| 314 | 294 |
| 340 | 317 |
| 331 | 317 |
| 333 | 310 |
| 329 | 327 |
| 322 | 300 |
| 332 | 293 |
| 330 | 321 |
| 338 | 307 |
| 325 | 304 |
The following Python code was run:
x1 = np.array([314, 340, 331, 333, 329, 322, 332, 330, 338, 325])
x2 = np.array([294, 317, 317, 310, 327, 300, 293, 321, 307, 304])

var_x1 = np.var(x1,ddof=1)
var_x2 = np.var(x2,ddof=1)
mean_x1 = np.mean(x1)
mean_x2 = np.mean(x2)

t_stat, p_value = stats.ttest_ind(x1, x2)
paired_t_stat, paired_p_value = stats.ttest_rel(x1, x2)

print("Variance of x1:", var_x1)
print("Variance of x2:", var_x2)
print("Mean of x1:", mean_x1)
print("Mean of x2:", mean_x2)
print("t-statistic (independent t-test):", t_stat)
print("p-value (independent t-test):", p_value)
print("t-statistic (paired t-test):", paired_t_stat)
print("p-value (paired t-test):", paired_p_value)
with the following results:
Variance of x1: 57.82222222
Variance of x2: 132.0
Mean of x1: 329.4
Mean of x2: 309.0
t-statistic (independent t-test): 4.682272020223192
p-value (independent t-test): 0.00018552038908779776
t-statistic (paired t-test): 6.168301872365076
p-value (paired t-test): 0.00016503831607051134
A new study in energy consumption during by bike rides is planned. We would like a 95\% confidence interval for $ \mu $ with a total width of $ 8$ kcal. How many bike rides should we approximately carry out to achieve this precision?
Question 5 of 7
The probability density functions of three normal distributions are shown below:
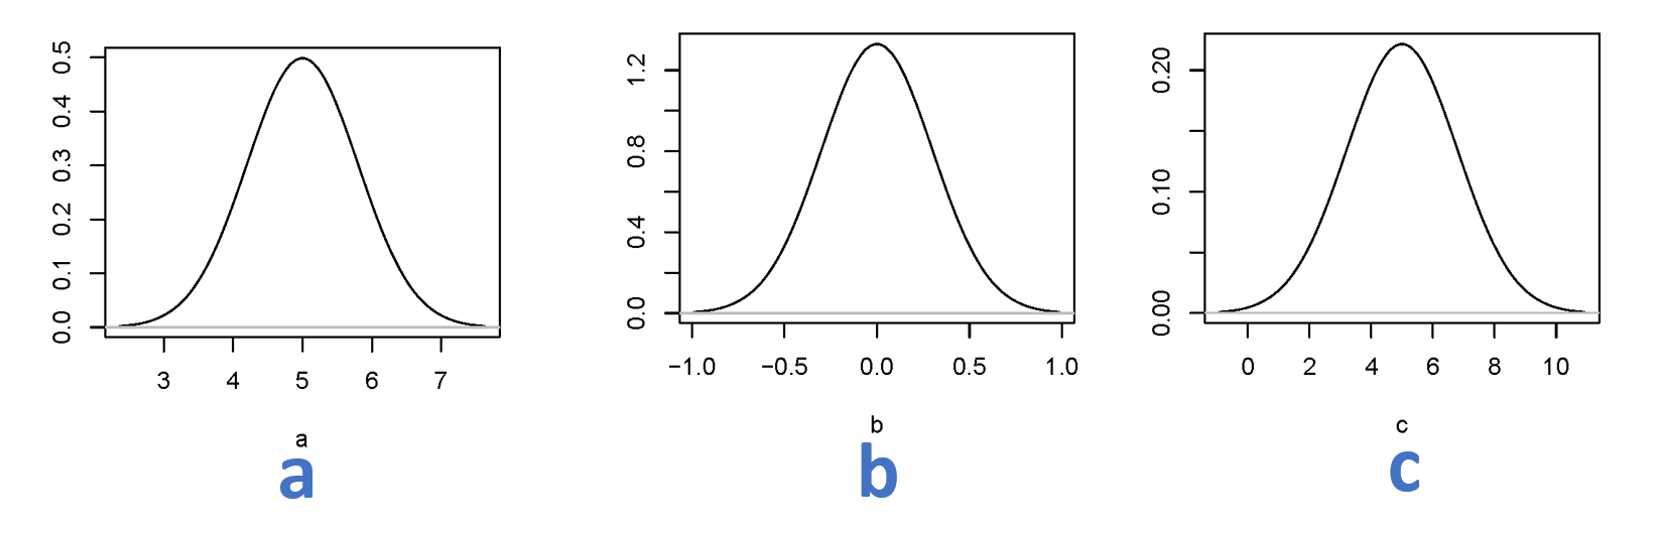
It is given that the standard deviation of the distribution in the middle is $\sigma = 0.3$. If you have to mention the three distributions in order after the size of the standard deviation, where you mention the distribution with the lowest standard deviation first and the distribution with the largest standard deviation at last, the correct order is?
Question 6 of 7
In order for a taxi company to make money, the number of customers for a given taxi driver should at least be 4 per. hour. In a period of 3 hours, 9 costumers were observed at a random selected taxi driver. It is desired to investigate whether there is reason to believe that the taxi company lose money on this taxi driver in the long run?
The $p$-value for such a test is given by:
Question 7 of 7
A strength calculation on an old tube in a construction is to be performed. Because of corrosion and age diameters are quite ‘indeterminate’. Therefore several measurements are made of as well outer as inner diameter. The measurements of outer respectively inner diameter are independent of each other. The results are listed below: (all dimensions in mm)
Outer diameter, x: 44.9, 44.2 , 44.6, 44.8 , 44.0, 45.1
Inner diameter, y: 32.4, 32.5, 31.5, 32.2, 32.6, 31.7
\[\left( {\bar x;{s_x}} \right) = (44.6;0.424)\,\mathrm{mm}\quad \mbox{and} \quad \left({\bar y;{s_y}} \right) = (32.15;0.451)\,\mathrm{mm}\]Assume that the standard deviation of the measurements on the outer diameter is $\sigma_x = 0.43$. A new study is planned in which the outer diameter should be determined with an accuracy corresponding to a 95% confidence interval of size $\pm $ 0.1.
What number of measurements, $ n $ is required?